FigureSpec
spec.figure is a FigureSpec — figure-level properties (size, resolution, backgrounds,
font). Used when the spec creates its own figure.
import behaviz as bv

spec = bv.PlotSpec(
    figure=bv.FigureSpec(figsize=(8, 5), dpi=150, face_color="#101010", axes_color="#181818"),
    text_color="#e0e0e0",
)
bv.plot_line("t", "v", data=df, spec=spec)
Fields
| Field | Default | Meaning |
|---|---|---|
figsize |
(12, 8) |
figure size, inches |
dpi |
120 |
dots per inch |
tight |
True |
call tight_layout() automatically |
style |
"default" |
a plt.style name, a preset, or a raw rcParams dict |
face_color |
None |
figure background (None → backend default) |
axes_color |
None |
plot-area background |
font_family |
None |
font family for all text |
Examples
Size & resolution
bv.FigureSpec(figsize=(6, 4), dpi=300) # print-ready
Dark backgrounds, without a preset
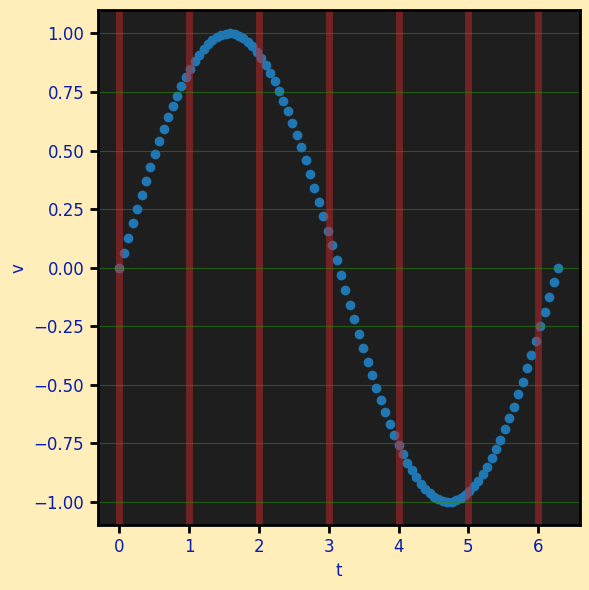
face_color/axes_color are first-class fields and they work on bokeh too. Pair with PlotSpec.text_color so labels stay legible.
import behaviz as bv
import numpy as np
import polars as pl

x = np.linspace(0, 2 * np.pi, 100)
y = np.sin(x)

df = pl.DataFrame({"t":x,"v":y})

spec = bv.PlotSpec(
    figure=bv.FigureSpec(face_color="#ffebb1e0",
    axes_color="#1e1e1e"),
    text_color="#061fad",
    x=bv.AxisSpec(grid_color="#c42828"),
    y=bv.AxisSpec(grid_color="#299803"),
)

bv.plot_scatter("t","v",data=df, spec=spec)
Raw rcParams via style
For matplotlib/seaborn you can still drop a full rcParams dict on style (line widths,
marker sizes, fonts). bokeh has no rcParams, so it honours background and text colour
only from a style — which is why the discrete fields above exist.
bv.FigureSpec(style={"lines.linewidth": 3, "axes.facecolor": "#fafafa"})
Presets set these for you
The built-in presets (presentation, presentation_dark, print, …) populate
face_color/axes_color/font_family/spine/tick fields from their rcParams, so a
preset renders the same on all three backends. See Presets.