AxisSpec
spec.x and spec.y are each an AxisSpec — independent, so the two axes can
differ in scale, ticks, grid, spines, everything below.
import behaviz as bv
import numpy as np
import polars as pl
x = np.linspace(0, 2 * np.pi, 100)
y = np.sin(x)
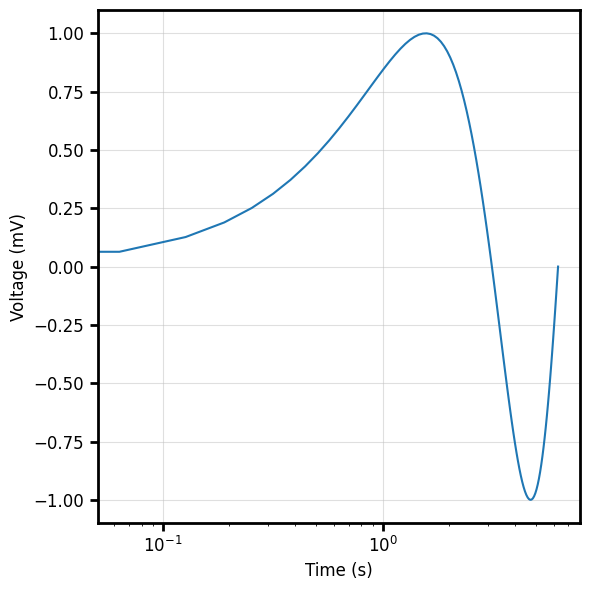
spec = bv.PlotSpec(
x=bv.AxisSpec(label="Time", unit="s", scale=bv.ScaleType.LOG),
y=bv.AxisSpec(label="Voltage", unit="mV", scale=bv.ScaleType.LINEAR),
)
bv.plot_line("t", "v", data=df, spec=spec)
Cross-backend
Every field below takes effect on matplotlib, seaborn and bokeh, except the two
marked matplotlib only (spine_offset, spine_trim) — bokeh has no spine model —
and tick_sides, which on bokeh can only toggle the primary side (bottom/left).
Fields
| Field | Default | Meaning |
|---|---|---|
label |
"" |
axis label |
unit |
"" |
appended automatically → "Voltage (mV)" |
fontsize |
12 |
label + tick-label font size |
scale |
"linear" |
linear / log / symlog / logit |
lim |
None |
(min, max) or None → auto |
ticks |
None |
explicit tick positions (numbers, or strings → categorical labels) |
tick_fmt |
None |
printf format, e.g. "%.2f" |
invert |
False |
flip axis direction |
spines |
all four | which spines to draw |
spine_width |
2 |
spine line width |
spine_color |
None |
spine colour (None → backend default) |
spine_offset |
0 |
push spine outward, px — matplotlib only |
spine_trim |
False |
clip spine to the outer ticks — matplotlib only |
tick_dir |
"out" |
tick direction: out / in / inout |
tick_length |
None |
tick length (None → 3 × spine_width) |
tick_width |
None |
tick line width (None → spine_width) |
tick_color |
None |
tick colour |
tick_sides |
None |
sides that show tick marks (["bottom"], ["left","right"], …) |
grid |
True |
major grid on |
grid_minor |
False |
minor grid on |
grid_color |
"#c1c1c1" |
grid colour |
grid_alpha |
0.5 |
grid opacity |
grid_style |
"-" |
major grid linestyle (-, --, :, -.) |
grid_width |
0.8 |
major grid line width |
Examples
Labels, units, scales, limits font size... everything!
spec = bv.PlotSpec(
    x=bv.AxisSpec(label="t", fontsize=16, lim=(0, 10)),
    y=bv.AxisSpec(unit="Hz", fontsize=16, lim=(1e-3, 1e2), scale=bv.ScaleType.LOG, grid_minor=True),
)

bv.plot_line("t", "v",data=df, spec=spec)

Ticks: direction, length, width, colour
spec = bv.PlotSpec(
    x=bv.AxisSpec(label="t",fontsize=16,lim=(0, 10)),
    y=bv.AxisSpec(tick_dir="in", tick_length=8, tick_width=2, tick_color="#E023E0"),
)

bv.plot_line("t", "v", ax=ax,data=df, spec=spec)

Spines: subset, colour, despine offset/trim
# only the left & bottom spines, pushed 8px outward and trimmed to the data
spec = bv.PlotSpec(
    x=bv.AxisSpec(label="t",fontsize=16,lim=(0, 10)),
    y=bv.AxisSpec(spines=["left", "bottom"], spine_color="#EC2525",spine_offset=8, spine_trim=True),
) # offset/trim: matplotlib/seaborn

bv.plot_line("t", "v", ax=ax,data=df, spec=spec)

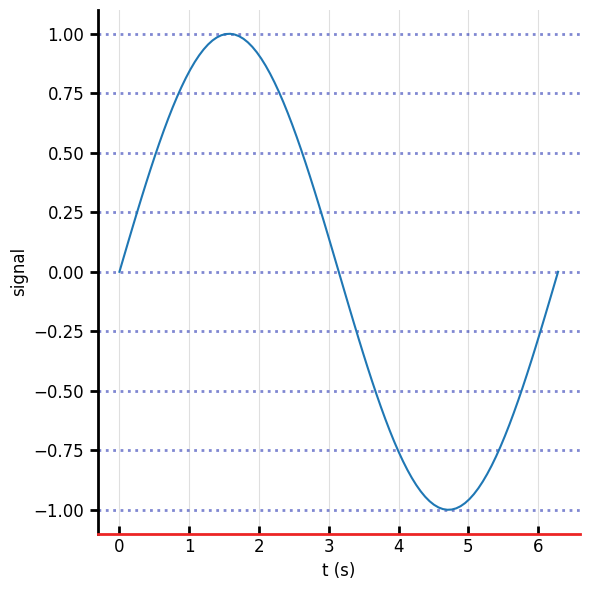
Same call, three backends
A single spec renders the same on every backend:
import numpy as np
import polars as pl
import behaviz as bv
from bokeh.io import show, output_notebook

x = np.linspace(0, 2 * np.pi, 100)
y = np.sin(x)

df = pl.DataFrame({"t":x,"v":y})

spec = bv.PlotSpec(
        x=bv.AxisSpec(label="t", unit="s", spine_color="#EC2525",tick_dir="in"),
        y=bv.AxisSpec(label="signal", spines=["left", "bottom"], grid_width=2, grid_style=":",grid_color="#0010a4"),
    )
bv.set_renderer("matplotlib")
fig, ax = bv.plot_line("t", "v", data=df, spec=spec)
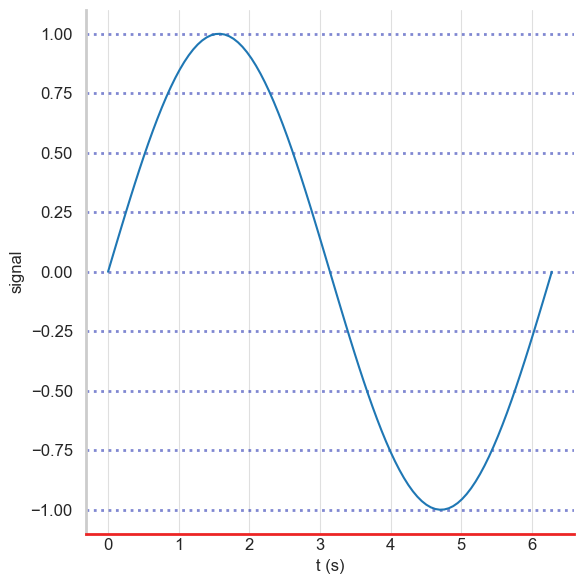
bv.set_renderer("seaborn")
fig, ax = bv.plot_line("t", "v", data=df, spec=spec)
bv.set_renderer("bokeh")
fig, ax = bv.plot_line("t", "v", data=df, spec=spec)
show(fig)