ColorbarSpec
Describes the colorbar attached to plot_image and plot_hexbin. You rarely build one by
hand thanks to the colorbar= argument.
colorbar= accepts True (default bar), a str (its label), or a ColorbarSpec.
import numpy as np
import behaviz as bv
import matplotlib.pyplot as plt
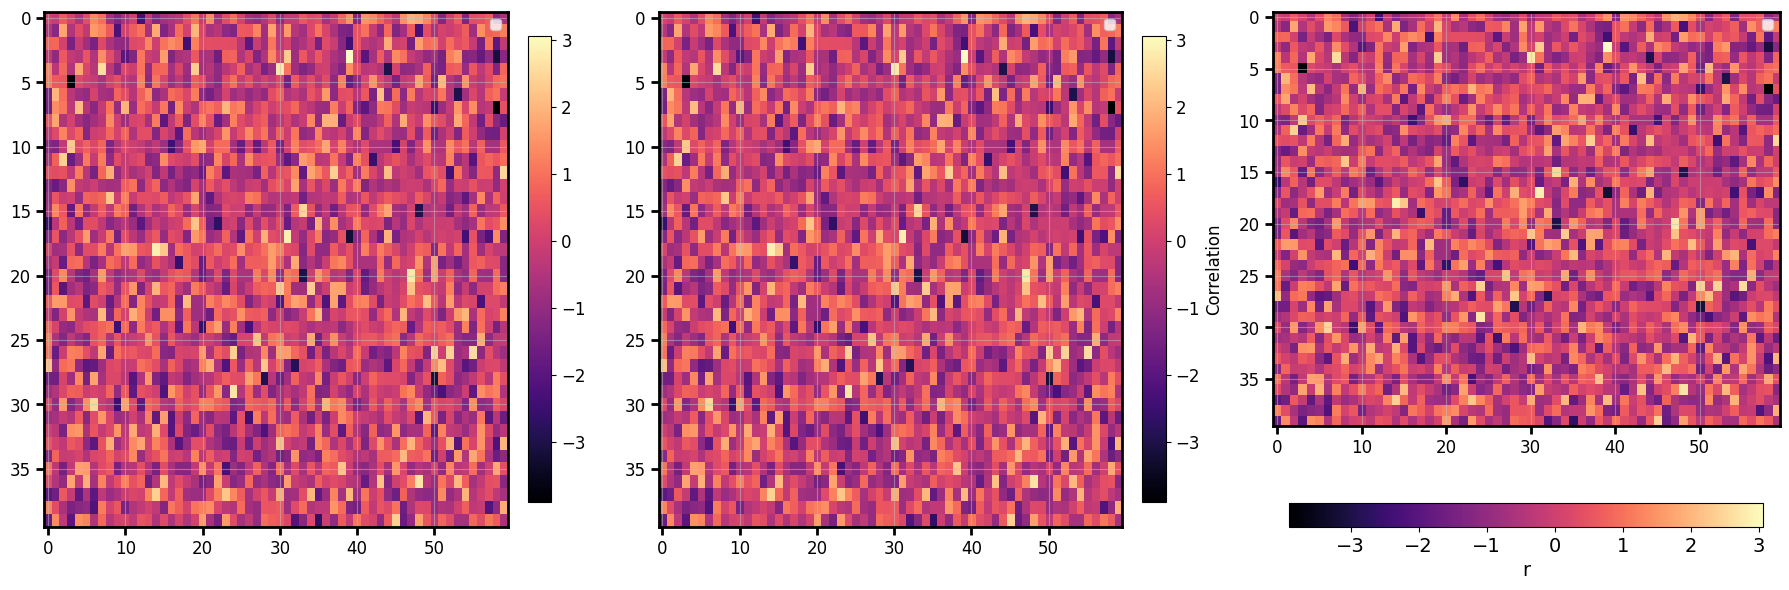
fig,axs = plt.subplots(1,3,figsize=(18,6,)) # for matplotlib and seaborn backends
data = np.random.default_rng(0).normal(size=(40, 60))
fig, ax = bv.plot_image(data, cmap="magma")
bv.plot_image(matrix, ax=ax[0], cmap="magma", colorbar=True) # default bar
bv.plot_image(matrix, ax=ax[1], cmap="magma", colorbar="Correlation") # str → labelled bar
bv.plot_image(matrix, ax=ax[2], cmap="magma",
colorbar=bv.ColorbarSpec(label="r", location="bottom", fontsize=14)) # full control
Fields
| Field | Default | Meaning |
|---|---|---|
label |
"" |
colorbar label |
location |
"right" |
right / left / top / bottom |
ticks |
None |
explicit tick positions |
tick_fmt |
None |
printf format, e.g. "%.1f" |
fraction |
0.046 |
bar size as a fraction of the axes (matches axes height by default) |
pad |
None |
gap between axes and bar (None → sensible default) |
fontsize |
12 |
label + tick-label font size |
matplotlib / seaborn
Colorbars are a matplotlib construct; behaviz renders them on the matplotlib and seaborn backends. The bokeh backend draws the image itself but does not yet attach a behaviz colorbar.