Data input
behaviz accepts numpy arrays directly, or column names resolved against a data=
source (a pandas/polars DataFrame or a dict).
Resolution rules
import numpy as np
import polars as pl # or pandas, both work identically
import behaviz as bv
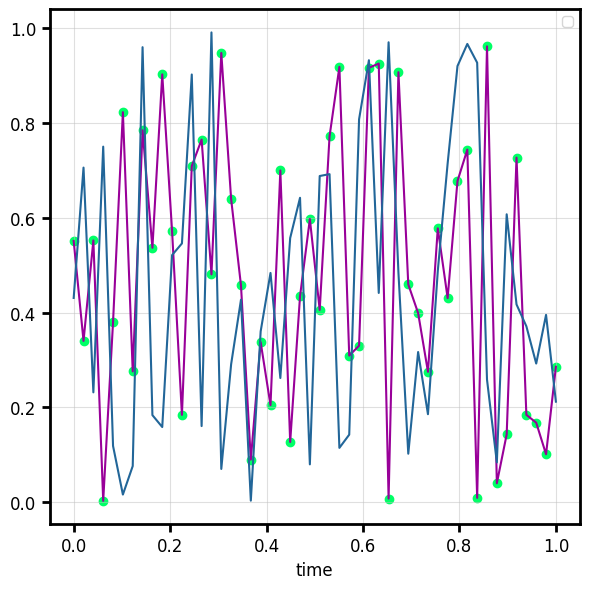
df = pl.DataFrame({"time": np.linspace(0, 1, 50),
"voltage": np.random.rand(50)})
# keyword column names
fig, ax = bv.plot_line(x="time", y="voltage", data=df, color="#990099")
# positional column names work too
fig, ax = bv.plot_scatter("time", "voltage", data=df, ax=ax, color="#00FF66")
# mix and match: a column name for x, a raw array for y
fig, ax = bv.plot_line(x="time", y=np.random.rand(50), data=df, ax=ax, color="#226699")
The rule is the same one seaborn uses: when data is given, a string means "column
name"; otherwise everything is treated as raw data. Arrays without data= behave
exactly as before.
When a channel comes from a named column and you haven't set a label, behaviz uses the column name automatically
Supported data sources: anything that responds to
data["column"]and yields an array: pandas DataFrame, polars DataFrame, ordict[str, array]. (Pass an eager polars frame; call.collect()on aLazyFramefirst.)
Validation & errors
Every plot function declares a contract for its data arguments through channels, and behaviz validates your input according it before plotting — so you can pass whatever you have:
- lists, tuples, NumPy arrays, pandas/polars Series, ranges, generators -> all become arrays
- scalars are promoted where they make sense (
plot_vertical(1.5),plot_bar(..., width=0.2)) - trivial 2-D shapes
(N, 1)/(1, N)are squeezed to 1-D - grouped inputs (
plot_violin'sys) accept a list of arrays (can be ragged lengths)
When the input genuinely doesn't fit, behaviz raises a BehavizDataError
(a ValueError subclass) that names the offending argument, shows what it got, and
suggests a fix:
rng = np.random.default_rng(0)
positions = np.arange(0,5)
distributions = [rng.normal(loc=p, scale=0.5, size=200) for p in np.arange(0,6)]

fig, ax, vp = bv.plot_violin(positions, distributions)

#error message:
BehavizDataError: plot_violin: `ys` must have the same length as `x`.
  x : ndarray shape (5,)
  ys: list of 6 arrays (lengths 200, 200, 200, 200, 200, 200)
Hint: got 5 vs 6 — pass one `ys` entry per `x` entry.
See also
- Grouping — split by
hue=/group=.