Composite plots
One idea behind behaviz is to give flexibility and freedom to create composite plots using the provided primitives. That's why every primitive outputs a figure and an axes object, so it can be used with others and if needed directly modified with the selected backends' built-in methods (e.g. ax.set_xlim() for matplotlib).
Building your own plots
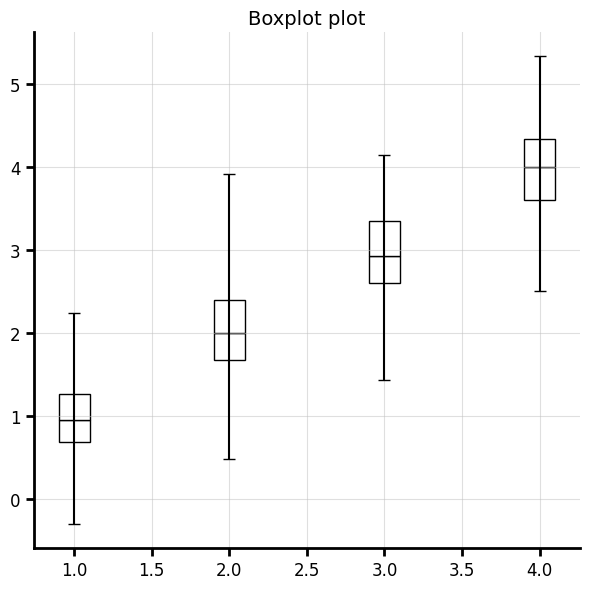
We will build a boxplot as an example. First, set a spec that you want to use (optional)
import behaviz as bv
from behaviz.spec import PlotSpec, AxisSpec, ScaleType, FigureSpec

BOXPLOT_SPEC = PlotSpec(
    figure=FigureSpec(figsize=(10, 10), dpi=300),
    x=AxisSpec(scale=ScaleType.LINEAR, spines=["bottom", "left"]),
    y=AxisSpec(scale=ScaleType.LINEAR, spines=["bottom", "left"]),
    title="Boxplot plot",
)
A simple boxplot can be composed of a plot_bar and a plot_errorbar. And we can use the canvas context manager to quickly combine the plots
pos    = np.array([1.0, 2.0, 3.0, 4.0])
dists  = [rng.normal(loc=p, scale=0.5, size=200) for p in pos]

with bv.canvas(spec=BOXPLOT_SPEC, ax=ax) as ax:
    # plot the errorbar with min and max extrema
    mins = np.array([np.nanmin(yi) for yi in dists])
    maxs = np.array([np.nanmax(yi) for yi in dists])
    medians = np.array([np.nanmedian(yi) for yi in dists])

    err = np.vstack(((medians - mins).reshape(1, -1), (maxs - medians).reshape(1, -1)))

    _, ax = bv.plot_errorbar(pos, medians, err, color="#000000", linewidth=0,capsize=4, ecolor="#000000")

    # plot the bars with IQR-median-IQR
    t_iqr = np.array([np.nanquantile(yi, q=0.75) for yi in dists])
    l_iqr = np.array([np.nanquantile(yi, q=0.25) for yi in dists])


    _, ax = bv.plot_bar(pos, l_iqr - medians, bottom=medians,color="#FFFFFF",edgecolor="#000000")
    _, ax = bv.plot_bar(pos, t_iqr - medians, bottom=medians,color="#FFFFFF",edgecolor="#000000")
behaviz already comes with some composed plots built-in. They live under behaviz.composite_plots. Available modules (so far): boxplot, raincloudplot, lollipopplot, parallelplot, hist1dplot
Composite plot API's can change