Annotation plots
These plots are mostly for annotating on an already , but can also be used independently if desired.
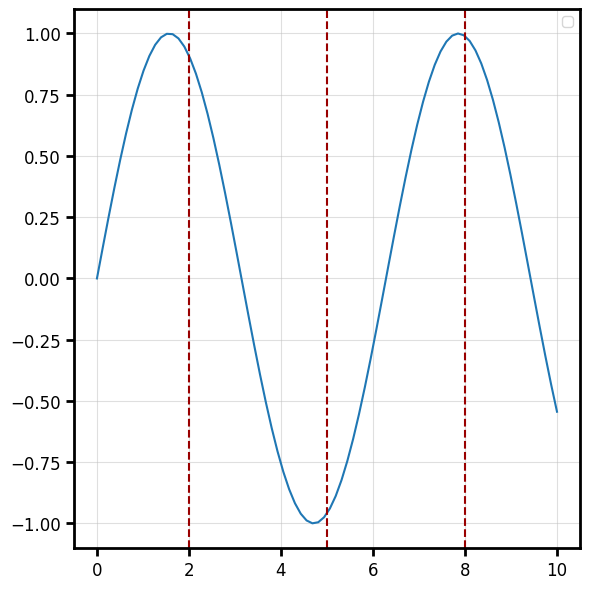
Vertical lines — plot_vertical
Reference lines spanning the y-range at given x positions.
import numpy as np
import behaviz as bv

x = np.linspace(0, 10, 80)
y = np.sin(x)

fig, ax = bv.plot_line(x, y)

#using the ```ax``` argument to plot it on the already created plot.
bv.plot_vertical([2.0, 5.0, 8.0], ax=ax, color="#990000", linestyle="--")
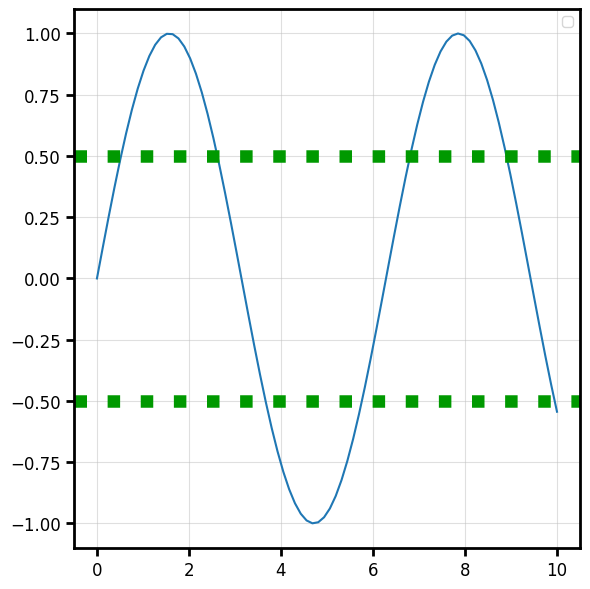
Horizontal lines — plot_horizontal
Reference lines spanning the x-range at given y positions.
bv.plot_horizontal([-0.5, 0.5], ax=ax, color="#009900", linewidth=9,linestyle=":")
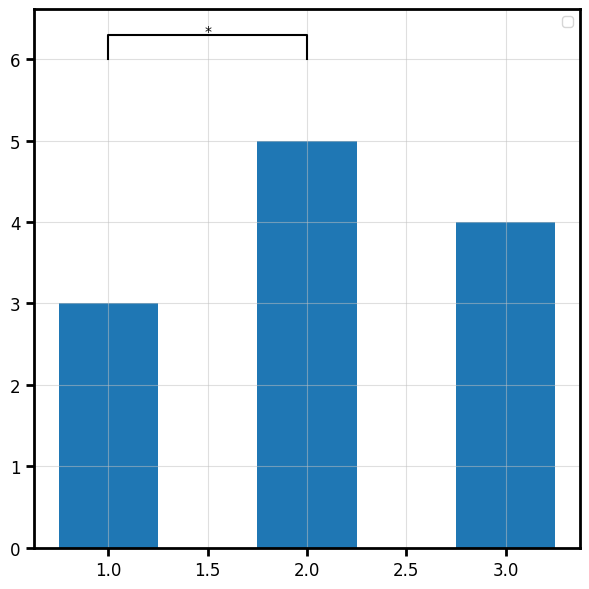
Significance bracket — plot_pval
Draws a comparison bracket with a p-value / significance label between two positions.
fig, ax = bv.plot_bar([1.0, 2.0, 3.0], [3.0, 5.0, 4.0],width=0.5)
bv.plot_pval(p_val=0.01, pos=[1.0, 2.0], loc=6.0, ax=ax)
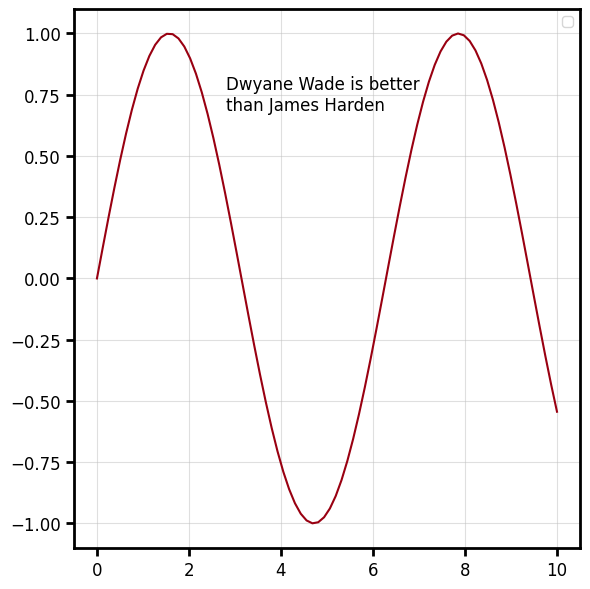
Text annotations
Add a text annotation on a designated spot on the plot. The positioning can be done in the data-space(coords=data) or the figure space (coords=axes).
f,ax = bv.plot_line(x,y,color="#990011")
bv.plot_text(2.8,0.75,"Dwyane Wade is better\nthan James Harden",ax=ax, ha="left")